Fwd: instable checkpointing after migration to flink 1.8

classic Classic list List threaded Threaded
5 messages Options
Reply | Threaded
Open this post in threaded view
|

Fwd: instable checkpointing after migration to flink 1.8

Bekir Oguz
Sending again with reduced image sizes due to Apache mail server error.

Begin forwarded message:

From: Bekir Oguz <[hidden email]>
Subject: Re: instable checkpointing after migration to flink 1.8
Date: 17 July 2019 at 11:10:41 CEST
To: Congxian Qiu <[hidden email]>

Hi Congxian,
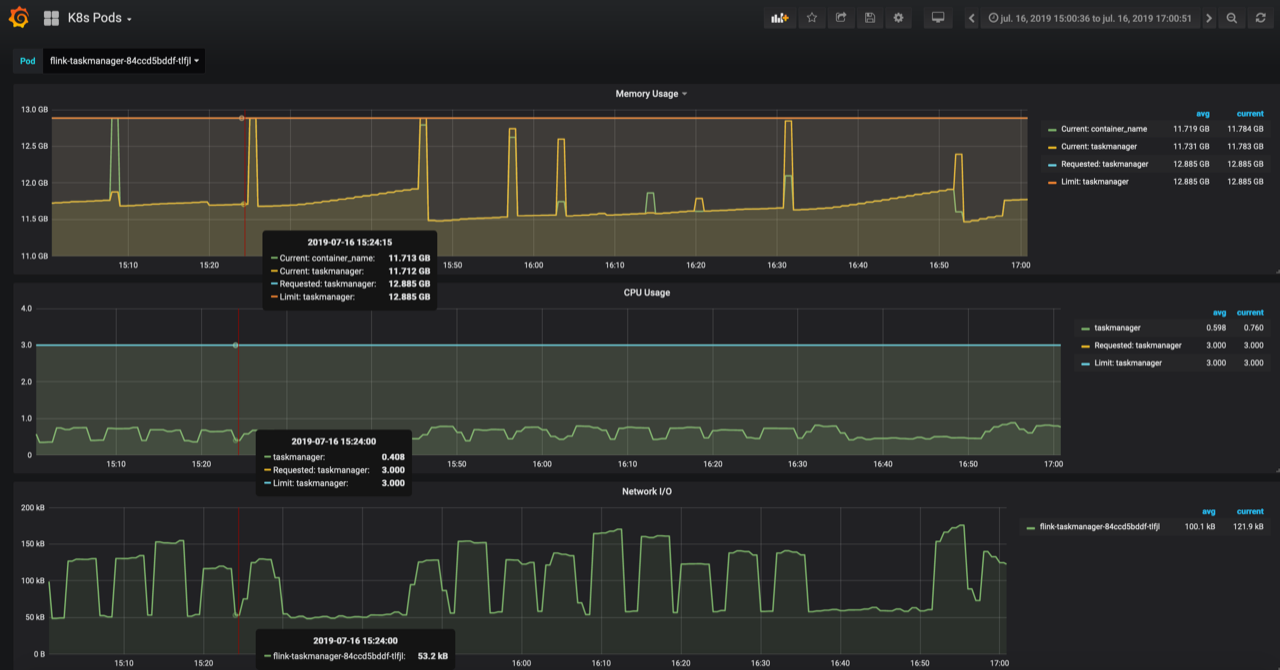
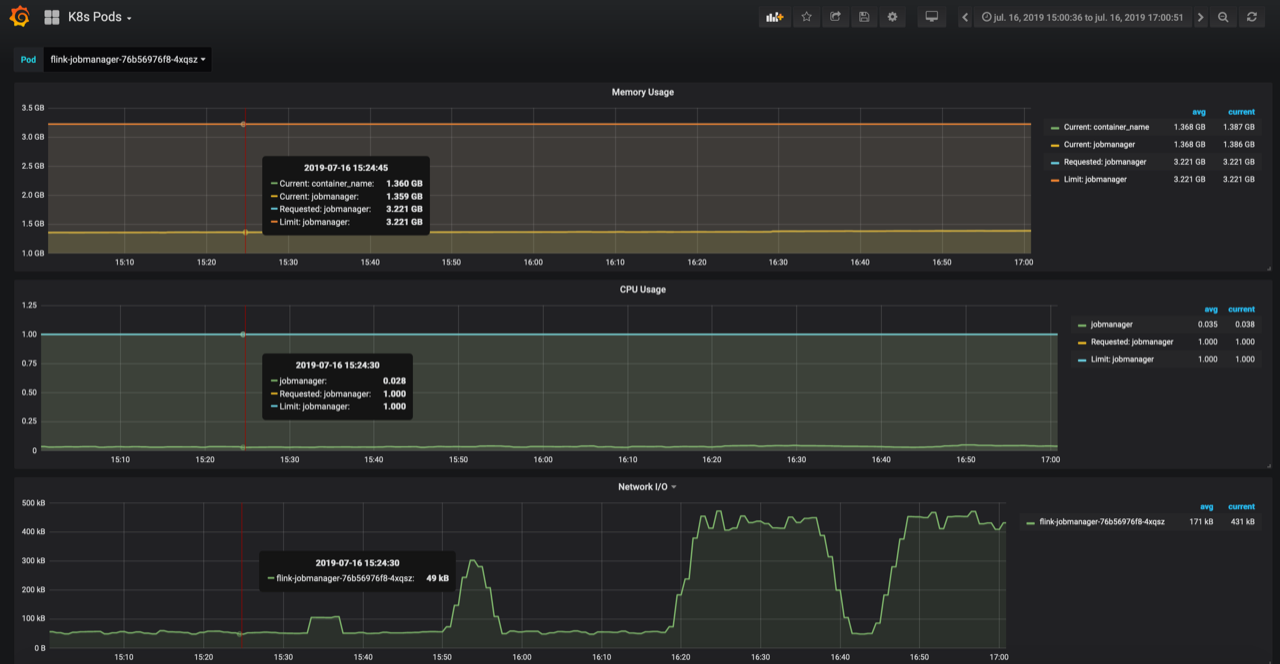
Thanks for your response. Here are the memory/cpu/network usage of the task manager and the job manager pods around that time.
The vertical line is the moment the checkpoint is triggered (15:24) and acknowledgement received on 15:40. 

What we see is the memory usage is jumping around +1GB each time a checkpoint is triggered. We can also see the network bandwidth usage correlates with the checkpointing interval of 5 mins. After the checkpoint is triggered on 15:24 we see a normal network bandwidth usage for 5 mins and then nothing for about 15 mins which is the checkpoint ack time for this task slot. 

Regards,
Bekir


On 17 Jul 2019, at 09:16, Congxian Qiu <[hidden email]> wrote:

Hi Bekir

First of all, I think there is something wrong.  the state size is almost the same,  but the duration is different so much.

The checkpoint for RocksDBStatebackend is dump sst files, then copy the needed sst files(if you enable incremental checkpoint, the sst files already on remote will not upload), then complete checkpoint. Can you check the network bandwidth usage during checkpoint?

Best,
Congxian


Bekir Oguz <[hidden email]> 于2019年7月16日周二 下午10:45写道:
Hi all,
We have a flink job with user state, checkpointing to RocksDBBackend which is externally stored in AWS S3.
After we have migrated our cluster from 1.6 to 1.8, we see occasionally that some slots do to acknowledge the checkpoints quick enough. As an example: All slots acknowledge between 30-50 seconds except only one slot acknowledges in 15 mins. Checkpoint sizes are similar to each other, like 200-400 MB.

We did not experience this weird behaviour in Flink 1.6. We have 5 min checkpoint interval and this happens sometimes once in an hour sometimes more but not in all the checkpoint requests. Please see the screenshot below.

Also another point: For the faulty slots, the duration is consistently 15 mins and some seconds, we couldn’t find out where this 15 mins response time comes from. And each time it is a different task manager, not always the same one.

Do you guys aware of any other users having similar issues with the new version and also a suggested bug fix or solution?


Thanks in advance,
Bekir Oguz


Reply | Threaded
Open this post in threaded view
|

Re: instable checkpointing after migration to flink 1.8

Congxian Qiu
Hi Bekir

Sorry for the previous message, I didn't see the second image of your first message :(

From the second image of your first message, seems the sync part consumes too much time.
57    15:40:24(acknowledgement Time)   15m53s (End to End Duration)  464m(State size)  15M48s(Checkpoint Duration(Sync))  4s(Checkpoint Duration (Async)

Do you enable incremental checkpoint or not?
If you enable incremental checkpoint, then In the sync part of a checkpoint for a RocksDBStateBackend, we'll 1) flush all data from memory to sst files, 2) snapshot meta, 3) checkpoint the RocksDB, maybe we should check the disk info during the long checkpoint. 

If you disable incremental checkpoint, then in the sync part of a checkpoint for RocksDBStateBackend, we'll 1) snapshot meta; 2) get a snapshot from RocksDB

And another question for this is, do you ever change the user jar's logic when migrating from 1.6 to 1.8?

Best,
Congxian


Bekir Oguz <[hidden email]> 于2019年7月17日周三 下午5:15写道:
Sending again with reduced image sizes due to Apache mail server error.

Begin forwarded message:

From: Bekir Oguz <[hidden email]>
Subject: Re: instable checkpointing after migration to flink 1.8
Date: 17 July 2019 at 11:10:41 CEST
To: Congxian Qiu <[hidden email]>

Hi Congxian,
Thanks for your response. Here are the memory/cpu/network usage of the task manager and the job manager pods around that time.
The vertical line is the moment the checkpoint is triggered (15:24) and acknowledgement received on 15:40. 

What we see is the memory usage is jumping around +1GB each time a checkpoint is triggered. We can also see the network bandwidth usage correlates with the checkpointing interval of 5 mins. After the checkpoint is triggered on 15:24 we see a normal network bandwidth usage for 5 mins and then nothing for about 15 mins which is the checkpoint ack time for this task slot. 

Regards,
Bekir


On 17 Jul 2019, at 09:16, Congxian Qiu <[hidden email]> wrote:

Hi Bekir

First of all, I think there is something wrong.  the state size is almost the same,  but the duration is different so much.

The checkpoint for RocksDBStatebackend is dump sst files, then copy the needed sst files(if you enable incremental checkpoint, the sst files already on remote will not upload), then complete checkpoint. Can you check the network bandwidth usage during checkpoint?

Best,
Congxian


Bekir Oguz <[hidden email]> 于2019年7月16日周二 下午10:45写道:
Hi all,
We have a flink job with user state, checkpointing to RocksDBBackend which is externally stored in AWS S3.
After we have migrated our cluster from 1.6 to 1.8, we see occasionally that some slots do to acknowledge the checkpoints quick enough. As an example: All slots acknowledge between 30-50 seconds except only one slot acknowledges in 15 mins. Checkpoint sizes are similar to each other, like 200-400 MB.

We did not experience this weird behaviour in Flink 1.6. We have 5 min checkpoint interval and this happens sometimes once in an hour sometimes more but not in all the checkpoint requests. Please see the screenshot below.

Also another point: For the faulty slots, the duration is consistently 15 mins and some seconds, we couldn’t find out where this 15 mins response time comes from. And each time it is a different task manager, not always the same one.

Do you guys aware of any other users having similar issues with the new version and also a suggested bug fix or solution?


Thanks in advance,
Bekir Oguz


Reply | Threaded
Open this post in threaded view
|

Re: instable checkpointing after migration to flink 1.8

Bekir Oguz
Hi Congxian,
Yes we have incremental checkpointing enabled on RocksDBBackend.
For further investigation, I have logged into one task manager node which had 15 min long snapshotting and found the logs under some /tmp directory.
Attaching 2 logs files, one for a long/problematic snapshotting and one log file for a good/fast snapshot.

I know the problematic snapshot from the trigger time (14:22 today) on the task manager, that’s only a guess and I extracted the log events around that time in the bad_snapshot.log file.

And I also extracted events from 14:11 today from the same task manager in the good_snapshot.log file to be able to compare these two.

The only difference I can see is the compaction kicking in during the checkpointing in the bad_snaphot.log file.

Do these logs give more insight to explain what is going on?


Kind regards,
Bekir Oguz


On 17 Jul 2019, at 15:29, Congxian Qiu <[hidden email]> wrote:

Hi Bekir

Sorry for the previous message, I didn't see the second image of your first message :(

From the second image of your first message, seems the sync part consumes too much time.
57    15:40:24(acknowledgement Time)   15m53s (End to End Duration)  464m(State size)  15M48s(Checkpoint Duration(Sync))  4s(Checkpoint Duration (Async)

Do you enable incremental checkpoint or not?
If you enable incremental checkpoint, then In the sync part of a checkpoint for a RocksDBStateBackend, we'll 1) flush all data from memory to sst files, 2) snapshot meta, 3) checkpoint the RocksDB, maybe we should check the disk info during the long checkpoint. 

If you disable incremental checkpoint, then in the sync part of a checkpoint for RocksDBStateBackend, we'll 1) snapshot meta; 2) get a snapshot from RocksDB

And another question for this is, do you ever change the user jar's logic when migrating from 1.6 to 1.8?

Best,
Congxian


Bekir Oguz <[hidden email]> 于2019年7月17日周三 下午5:15写道:
Sending again with reduced image sizes due to Apache mail server error.

Begin forwarded message:

From: Bekir Oguz <[hidden email]>
Subject: Re: instable checkpointing after migration to flink 1.8
Date: 17 July 2019 at 11:10:41 CEST
To: Congxian Qiu <[hidden email]>

Hi Congxian,
Thanks for your response. Here are the memory/cpu/network usage of the task manager and the job manager pods around that time.
The vertical line is the moment the checkpoint is triggered (15:24) and acknowledgement received on 15:40. 

What we see is the memory usage is jumping around +1GB each time a checkpoint is triggered. We can also see the network bandwidth usage correlates with the checkpointing interval of 5 mins. After the checkpoint is triggered on 15:24 we see a normal network bandwidth usage for 5 mins and then nothing for about 15 mins which is the checkpoint ack time for this task slot. 

Regards,
Bekir

<PastedGraphic-3.png>

<PastedGraphic-4.png>


On 17 Jul 2019, at 09:16, Congxian Qiu <[hidden email]> wrote:

Hi Bekir

First of all, I think there is something wrong.  the state size is almost the same,  but the duration is different so much.

The checkpoint for RocksDBStatebackend is dump sst files, then copy the needed sst files(if you enable incremental checkpoint, the sst files already on remote will not upload), then complete checkpoint. Can you check the network bandwidth usage during checkpoint?

Best,
Congxian


Bekir Oguz <[hidden email]> 于2019年7月16日周二 下午10:45写道:
Hi all,
We have a flink job with user state, checkpointing to RocksDBBackend which is externally stored in AWS S3.
After we have migrated our cluster from 1.6 to 1.8, we see occasionally that some slots do to acknowledge the checkpoints quick enough. As an example: All slots acknowledge between 30-50 seconds except only one slot acknowledges in 15 mins. Checkpoint sizes are similar to each other, like 200-400 MB.

We did not experience this weird behaviour in Flink 1.6. We have 5 min checkpoint interval and this happens sometimes once in an hour sometimes more but not in all the checkpoint requests. Please see the screenshot below.

Also another point: For the faulty slots, the duration is consistently 15 mins and some seconds, we couldn’t find out where this 15 mins response time comes from. And each time it is a different task manager, not always the same one.

Do you guys aware of any other users having similar issues with the new version and also a suggested bug fix or solution?


Thanks in advance,
Bekir Oguz


bad_snapshot.log (25K) Download Attachment
good_snapshot.log (11K) Download Attachment
Reply | Threaded
Open this post in threaded view
|

Re: instable checkpointing after migration to flink 1.8 (production issue)

Bekir Oguz
Hi Congxian,
Starting from this morning we have more issues with checkpointing in production. What we see is sync and async duration for some subtasks are very long but what strange is the total of sync and async durations are much less than the total end to end duration. Please check the following snapshot:


For example, for the subtask 14: Sync duration is 4 mins, async duration 3 mins, end-to-end duration is 53 mins!!!
We have a very long timeout value (1 hour) for checkpointing, but still many checkpoints are failing, some subtasks cannot finish checkpointing in 1 hour.

We really appreciate your help here, this is a critical production problem for us at the moment.

Regards,
Bekir


On 17 Jul 2019, at 17:46, Bekir Oguz <[hidden email]> wrote:


And I also extracted events fr

Reply | Threaded
Open this post in threaded view
|

Re: instable checkpointing after migration to flink 1.8 (production issue)

Congxian Qiu
Hi, Bekir

First, The e2e time for a sub task is the $ack_time_received_in_JM - $trigger_time_in_JM. And checkpoint includes some steps on task side such as 1) receive first barrier; 2) barrier align(for exactly once); 3) operator snapshot sync part; 4) operator snapshot async part, the images you shared yesterday show that the sync part took a too long time, now the sync part and async part took some time long, and e2e time is much longer than sync_time + async_time. 
1. you can checkpoint whether your job has backpressure problems(backpressure may lead the barrier flows too slowly to the downside task.), if it has such a problem, you should better solve it first.
2. If do not have a backpressure problem, you can check the `Alignment Duration` to see if the barriers align took a too long time.
3. for sync part, maybe you can checkpoint the disk performance(if there did not have the metric, you can find the `sar` log in your machine)
4. for the async part, we can check the network performance(or some client network flow control)

Hope this can help you.

Best,
Congxian


Bekir Oguz <[hidden email]> 于2019年7月18日周四 下午6:05写道:
Hi Congxian,
Starting from this morning we have more issues with checkpointing in production. What we see is sync and async duration for some subtasks are very long but what strange is the total of sync and async durations are much less than the total end to end duration. Please check the following snapshot:


For example, for the subtask 14: Sync duration is 4 mins, async duration 3 mins, end-to-end duration is 53 mins!!!
We have a very long timeout value (1 hour) for checkpointing, but still many checkpoints are failing, some subtasks cannot finish checkpointing in 1 hour.

We really appreciate your help here, this is a critical production problem for us at the moment.

Regards,
Bekir


On 17 Jul 2019, at 17:46, Bekir Oguz <[hidden email]> wrote:


And I also extracted events fr